Logs, metrics and alerts, simplified
Easylogs
SaaS product, built and run by our team
Easylogs is a hosted observability product for small engineering teams who want to search logs, watch their servers and get alerted without running an ELK or Prometheus stack themselves. We built the whole pipeline. A multi-tenant ingestion service accepts JSON and NDJSON logs over HTTP and buffers them before they reach OpenSearch. A web app supports familiar query syntax, field management and saved searches. Server metrics come from a one-line installer that registers the host with VictoriaMetrics. Alert rules notify Slack or Telegram, and an AI agent calls a log-search tool to answer questions in plain language. The product began as a Django and React app and was later rewritten as a single Go service, and it ships a cross-platform CLI with a macOS menu-bar mode.
Visit the live product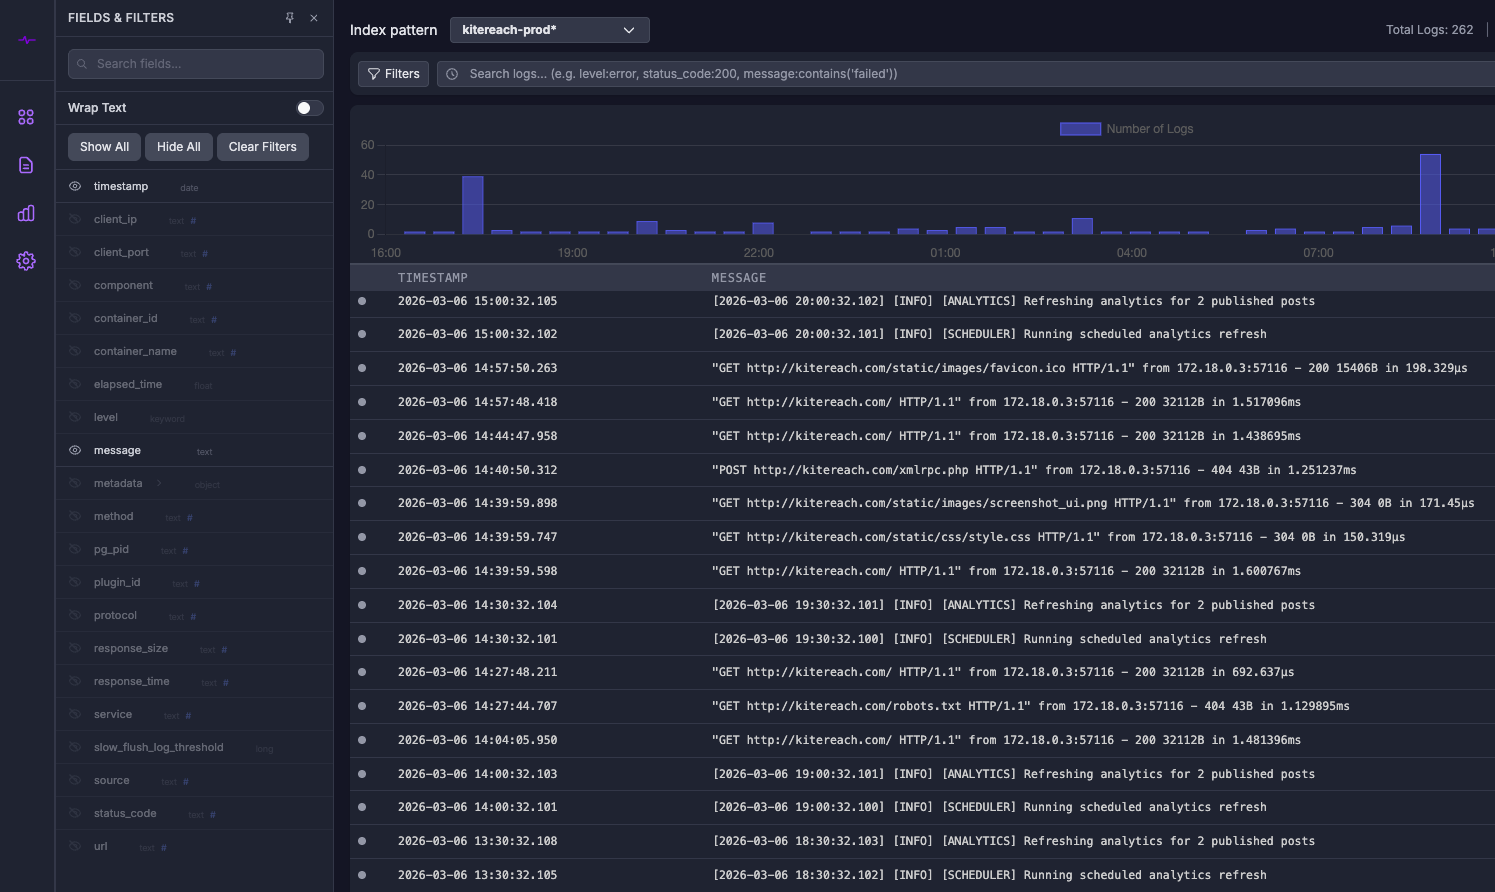
At a glance
- Product type
- B2B SaaS: hosted logging, infrastructure metrics and alerting
- Problem
- Self-hosting ELK or Prometheus is heavy for a small team, while hosted tools are expensive and hard to query under pressure
- Solution
- Per-tenant log storage behind a buffered Go ingestor, a focused search UI, server metrics, alert rules and an AI log agent
- Timeline
- First version in late 2024, a dedicated Go ingestor in early 2025, and a full Go rewrite of the app later that year
- Engineering
- 141 commits across four repos, ~20,000 lines of Go across app and ingestor, ~90 HTTP routes, 28 data models
- Stack
- GoPostgreSQLRedisOpenSearchVictoriaMetricsnode_exporterStripeGemini
The challenge
Observability tools are only useful if logs arrive reliably and a problem is easy to find at the moment someone is under pressure. For a small team the usual choices are a heavy self-hosted stack or a hosted tool whose cost and query language get in the way.
Ingestion that doesn't drop data
Logs must keep flowing when the search cluster slows down or restarts.
Multi-tenancy
Each customer's logs and credentials kept separate on a shared cluster.
Messy data
Nested JSON, inconsistent field types and changing timestamp fields all have to be searchable.
Metrics without the setup
Server monitoring that doesn't require configuring Prometheus.
Alerts where the team is
Notifications in the tools the team already uses.
What we built
A buffered, multi-tenant ingestor
- A Go service accepting JSON and NDJSON logs over HTTP, with token authentication and cached credentials.
- A two-tier buffer, memory with overflow to disk, plus a write-ahead log so logs survive slowdowns and restarts.
- Adaptive throttling based on cluster response times, daily per-tenant indices and horizontal scaling.
Log search for when it matters
- A KQL-style query language translated into OpenSearch queries.
- Field mappings with type conversion and reindexing, and a selectable timestamp field.
- Autocomplete, saved searches, history, collapsible nested data and a side panel for a single log.
- Volume and error trend charts on the dashboard.
Server metrics and alerting
- A per-user one-line installer that starts node_exporter and registers the host for scraping.
- Metric queries filtered to each user's own hosts.
- A background evaluator runs threshold rules and notifies Slack or Telegram, with a test-send button and event history.
AI log agent, CLI and menu bar
- A streaming chat agent with a log-search tool that runs real queries against the user's own indices.
- A CLI for macOS and Linux with login, logs, metrics, alerts, agent and an interactive shell.
- A macOS menu-bar mode showing live status.
Accounts and billing
- Email signup with verification, Google sign-in and revocable API tokens.
- Stripe subscriptions with webhooks, payment-method updates and invoices.
Security and operations
- Passwords hashed with bcrypt; API tokens generated from cryptographically random bytes and revocable.
- Each tenant gets its own search account and index prefix, and API routes require authentication and a verified email.
- The ingestor never blocks callers on cluster health: the buffer, disk queue and write-ahead log absorb backpressure.
- Health checks and Docker-based deploys with Kamal.
Results
A complete observability product
Ingestion, storage, search, metrics, alerts, billing and a CLI, built and operated by a small team.
A clean move from Django to Go
The app was rewritten as one Go service while keeping its data model and features.
Live at easylogs.co
With a separate app, ingestion endpoint and docs site.
One step to get started
A single install command connects a server's metrics, and logs arrive over plain HTTP.
Key takeaways
-
1
Buffer before you index. A memory-to-disk buffer with a write-ahead log decides whether logs get dropped when the cluster has a bad minute.
-
2
Make the query language familiar. KQL-style syntax let users search the way they already know.
-
3
Give the AI agent real tools. The agent is useful because it runs actual searches on the user's data rather than guessing.
Have a process like this?
Tell us what is costing your team the most time. We will show you how we would scope it, build it and get it into production.